Key Takeaways
- A Raspberry Pi homepage dashboard provides personal system monitoring and information for at-a-glance viewing
- Options like Dashing and Freeboard make configuration easy without coding required
- Display real-time system data, weather, app shortcuts, and custom metrics
- Careful layout and visual styling creates clean, readable displays
- Automate dashboard updates with scripting and integrate advanced functionality over time
Having a custom homepage dashboard on your Raspberry Pi allows you to monitor system information and quickly access frequently used apps and tools. With some simple configuration, you can create a clean, organized dashboard tailored to your needs.
Table of Contents
Gather Required Hardware and Software
To get started, you’ll need:
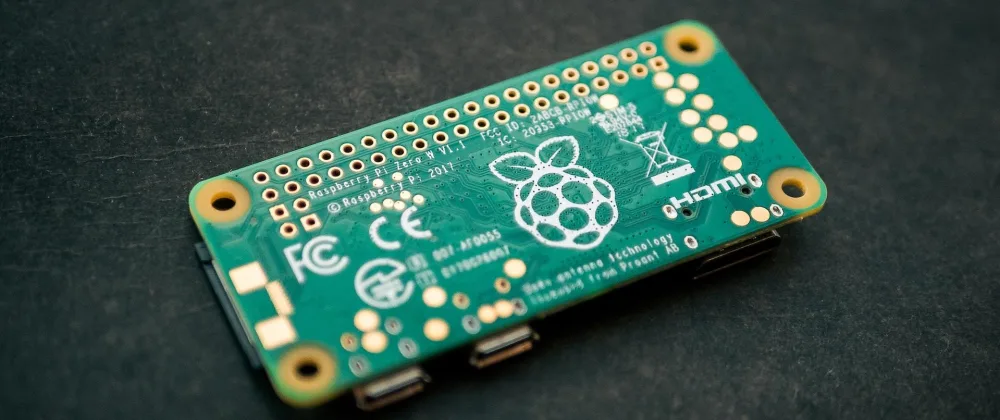
- A Raspberry Pi computer
- Raspberry Pi OS or another Linux distribution
- An SD card with the OS installed
- A monitor, keyboard, and mouse for initial setup
- Dashboard software like Dashing or Freeboard
It’s also helpful to have:
- WiFi connectivity for retrieving data
- A case to protect the Pi if displaying openly
Install the Dashboard Framework
There are a few different dashboard framework options for Raspberry Pi. Two top choices are:
Dashing
- Lightweight Ruby framework optimized for speed
- Easy to customize with HTML and CSS
- Data-driven approach updates displays dynamically
Freeboard
- Full-featured JavaScript dashboard builder
- Drag-and-drop interface for rapid prototyping
- Supports various data connections methods
To install your preferred framework, log into your Pi and use the appropriate package manager for your Linux distribution.
For example, with Raspberry Pi OS and Dashing:
sudo apt install dashingFollow the installation instructions for any dependencies.
Plan the Dashboard Content and Layout
Once your framework is installed, start planning out what you want to include on your homepage.
Consider displaying:
- Time and date – Always useful to see at a glance
- System resource usage – Such as CPU, memory, storage, network, etc
- Weather information – Show your local weather conditions
- Quick app launches – Shortcuts to often-used apps and tools
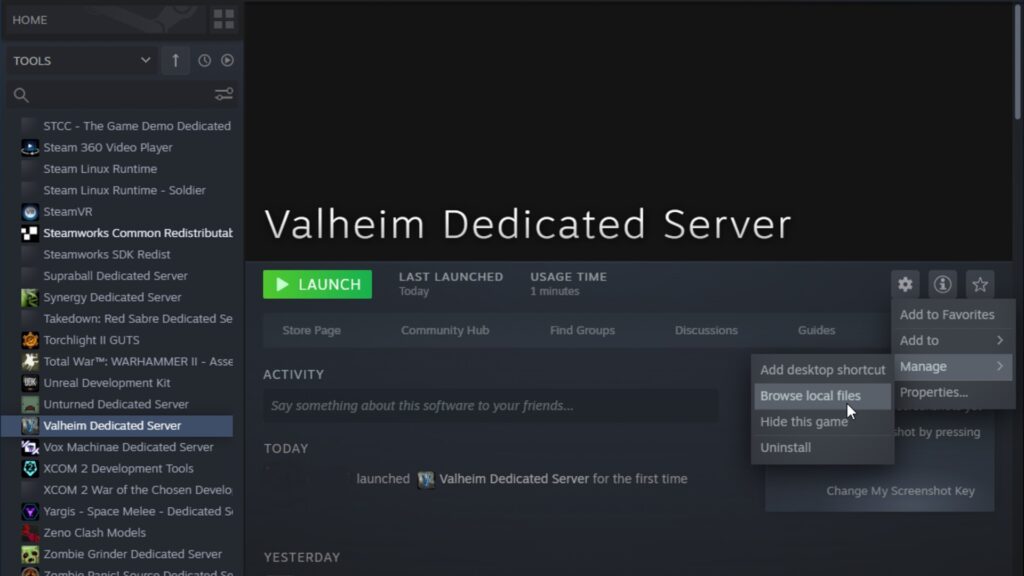
- Server monitoring – Stats from any servers your Pi connects to
- Personal metrics – Like step count, tasks completed, etc if you track them
Organize related content into widget groups or sections placed carefully around the page. Keep the most important info visible without excessive scrolling.
Configure Data Sources
Dashboard frameworks pull data dynamically from sources to populate widgets.
Good data sources for Raspberry Pi dashboards include:
- Built-in system monitors for usage statistics
- Weather provider APIs like OpenWeatherMap and Weather Bit for forecast data
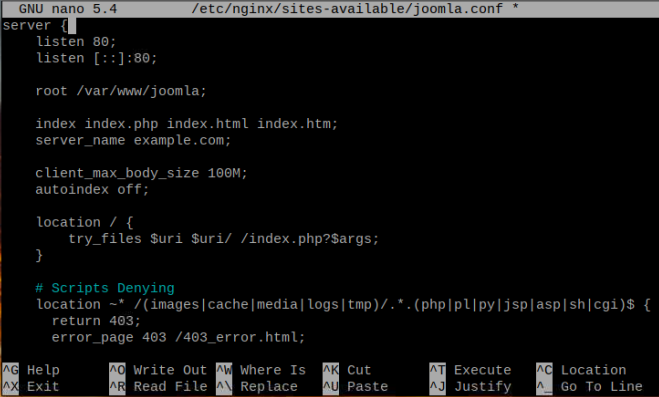
- JSON endpoints from any apps or services with API access
- Databases like Influx DB and MySQL to store collected metrics over time
Configure access credentials and connection settings for each desired source following the dashboard framework instructions. Test retrieving sample data before moving on.
Design the User Interface
With data sources ready, it’s time to start building and styling widgets in the framework editor.
Visually organize content into columns or regions:
- Header bar with page title, time, user profile shortcut
- Left vertical region for weather and metrics
- Main central region showing system resource usage
- Right vertical region with app shortcuts
Style the UI for readability and visual appeal:
- Use clean fonts like Open Sans
- Contrast background colors across sections
- Limit unnecessary decorations and graphical elements
- Leave ample negative space between widgets
Automate and Integrate
To reduce manual effort for maintaining your dashboard:
- Script data retrieval – Set cron jobs to update data sources on a schedule
- Automatically start the dashboard – Launch the dashboard server on Raspberry Pi bootup
- Display on a separate monitor – Hook up a secondary monitor to show only the dashboard
For advanced use, integrate with smart home assistants like Alexa or Google Home to voice control your dashboard.
Additional Customization Ideas
To make your Raspberry Pi dashboard even more handy:
- Control smart home devices right from the dashboard
- Create shortcuts to control GPIO devices and accessories
- Display a calendar widget showing upcoming events
- Add user-specific profiles for separate family member accounts
- Implement user authentication to restrict access
- Connect motion sensors to auto dim/brighten the display
The possibilities are endless for customizing a Pi dashboard to your needs and preferences. Start simple and evolve over time.
Setting up a properly organized dashboard takes your Raspberry Pi use to the next level. Following the steps outlined above makes the process smooth so you can start benefiting right away with a custom optimized homepage view.
Conclusion
Creating a custom dashboard for your Raspberry Pi allows you to monitor important information and access frequently used tools right from the convenience of the homepage. By leveraging dashboard builder frameworks, even users without coding experience can configure elegant display options. Approach the planning and layout in an organized manner for the best results. Automate updating data sources and explore advanced integrations over time to get the most out of your personalized Raspberry Pi dashboard.
FAQs
- What are the best dashboard builder options for Raspberry Pi?
Dashing and Freeboard are two excellent free dashboard tools specifically optimized for use with Raspberry Pi. They balance ease of use with customization flexibility. - What types of data visualizations can I add to a Raspberry Pi dashboard?
Common dashboard widgets include time/date displays, metrics gauges, bar and line graphs showing usage trends, calendar blocks, weather info boxes, and tables summarizing system resources. - How do I securely access my dashboard over the internet?
Using the OpenVPN service on your home router allows secure remote access to your private home network. Combined with user authentication on the dashboard itself, this protects full access from the public internet. - Can I display my dashboard full-screen or in kiosk mode?
Yes, Raspberry Pi OS has built-in kiosk mode settings allowing your dashboard server to launch in a full-screen web browser that locks access to other apps. - How difficult is it to get weather data on my dashboard?
Thanks to public weather APIs like OpenWeatherMap, adding weather widgets is quite simple without any coding. Just sign up for a free API key and follow the dashboard framework instructions to connect. - Can I display server monitoring stats from my hosted websites?
If your servers expose metrics via an API, you can normally add them as a data source. This may require a plugin for advanced features like website uptime monitoring. - Is there a way to control my Raspberry Pi or GPIO devices from my dashboard UI?
Yes, integrating device control involves some coding knowledge but allows cool functionality like toggling LED lights or automating equipment startup sequences right from dashboard buttons. - How do I automatically back up my dashboard configuration?
The dashboard app data is stored as plain files on your Pi OS, so any ordinary backup solution like rsync or cloud sync tools will preserve the custom dashboard. Just be sure to also back up any credentials used by data sources. - Can I restrict access to my dashboard or implement account security?
Yes, adding authentication methods or even multi-factor security is possible for protecting dashboard access. Or use simple password protection on the dashboard web server itself. - Does the dashboard impact Pi performance or network resources?
With lightweight frameworks optimized for efficiency, dashboard impacts are generally minimal. Just be mindful of background data polling frequency if relying on WiFi or metered internet connectivity. - What size monitor should I use to display my dashboard effectively?
Aim for at least a 10-inch display, as smaller screens make organizing multiple data widgets challenging. Larger tablet-sized displays in the 10 to 20-inch range provide ample flexible space. - Can I view my dashboard remotely when away from home?
Absolutely. Secure remote access options like a VPN tunnel or SSH port forwarding allow easy remote dashboard viewing from any internet-connected device. - How can I dim my dashboard display automatically at night?
Connecting GPIO breakout boards makes it easy to control display backlighting. Use a photoresistor light sensor to switch modes or integrate with home automation platforms to schedule brightness changes. - Do I need coding skills to build a custom dashboard?
The beauty of dashboard builder frameworks is no coding required for basic setups. But for advanced widgets or functionality, basic JavaScript, HTML, CSS skills are helpful. Leverage existing plugins where possible. - Can I use my smartphone or tablet as the dashboard display?
Yes, mobile apps like Touch Dash and AppsDash provide specially designed dashboards optimized for touch devices. Or use screen mirroring protocols like VNC or Airplay to looking glass your Pi desktop.